


Thank you for some other wonderful post. Where else may just anybody get that type of info in such an ideal way of writing? I have a presentation subsequent week, and I am on the search for such info.
What is a P Value?
December 31 2016
P value is one of the most important values in research, yet it is a challenging concept to understand. In this article, I am taking an intuitive approach using a weight loss example to explain the concept of p-value. Of course, I have omitted the details and technical terms to focus on the big picture. So here we go:
What is really a p-value?
P-value: P-value or probability value is arguably the most important value in science. Believe it or not, approval of drugs worth millions (maybe billions) of dollars or treatments that can save thousands of people finally comes down to this little p-value. You can usually find them in the abstract or the result section of a study
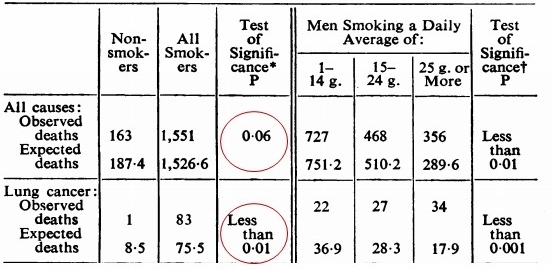
The picture below shows the result of the famous study by Doll and Hill in 1956. The study showed that smoking indeed causes lung cancer thereby saving millions of lives.
Why do we need a p-value?
Since now you know the importance of a p-value, why do we really need it??
Sample Study: Let’s take an example study where a researcher wants to know the average weight of the inhabitants of the planet Mars. Let’s imagine that the total population of this planet consist of 10 people and the average weight of the population is 150lbs.
He randomly selects a sample of 3 people.
1. He gets an average of 137lbs. And he proclaims that the average weight of the population in Mars is 137 lbs.
2. Now just to confirm his initial study, he takes another 3 people from the population of 10. Guess what, now he gets an average value of 140lbs.
3. He takes yet another sample of 3 people randomly. Now he gets a value of 147lbs. Now the researcher is really confused. Why are we getting different numbers? Is science broke?
Sampling error: These different or ‘wandering’ numbers are due to selecting different samples from the population. And hence called sampling error. Error in latin means “to wander”. So the question is how can we confidently say that the result of any study is due to our intervention and not due to sampling error. Or, in other words, how can we say it not due to ‘chance’?
And this is exactly why we need the p-value:We want to know if our results are due to the intervention or due to these sampling errors or ‘chance’. In short, p-value is way to tackle the problem of the sampling errors when you are trying to infer something about a population. So anytime you hear P value, think about sampling error.
So how does this p-value work?
Now here comes the million-dollar question; but how on earth does the p-value ever know when the results are due to sampling error or the intervention?
Let’s take a personal weight loss scenario: Imagine you are trying to lose weight on a new diet. One morning you step on the scale and the scale says you lost 1lb (164lbs) and you just carry on with your daily stuff. A few weeks later you step on the scale and now it shows you lost 2lbs (163lb) and you carry on with your daily routine. A few weeks later, you step on the scale and now you have lost 5 lbs (160lb)!! Wow…all of a sudden you are so excited and you tell all your friends and people at work that the weight loss diet works!
Now the question is why were you so excited about the 5 lb loss, but did not give a damn about the 1-2lbs loss? Why? Why? The answer is you are using your own ‘P-value’ or probability by comparing your weight loss numbers to a personal distribution graph that you carry in your head. So what is this personal distribution graph?
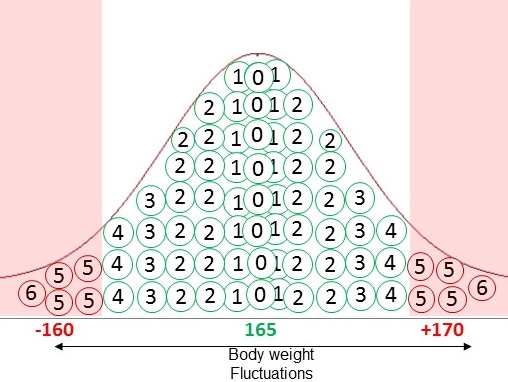
Personal distribution graph: This personal distribution graph reflects the probability of your typical weight fluctuations in your adult life. As shown, it could be weight gain or weight loss. There are three main points to this graph that is very important to keep in mind.
- Not dieting: This graph based on your body weight measurements when you are NOT on a diet or when you are NOT trying to change your weight. Hence this your typical or default changes in weight. These weight changes could be due to skipping meal, on a trip/vacation and having too much food, water weight changes, measurement error, being sick, working too hard, and so forth.
- High Probability area: The high probability area in green color represents of the middle of the curve. As you can see majority of the time in your life your weight loss is around +3 to -3lbs. That means, there is a very high probability that majority of the times your weight loss/gain in the +3 to -3 lbs. The weight fluctuations in this area could be just water weight or measurement errors or missing a meal or so forth.
- Low Probability area: The low probability area in red color represents the tail end of the curve. As you can see, only a few times in your life your weight loss/gain as high as 5 lbs. That means, there is a very low probability that your weight loss/gain is 5 lbs or more. Those were the times when you were sick and lost weight or went on a vacation and gained a lot of weight or due to dome other unknown reasons.
Now back to our 5 lb loss. Since the weight loss of 5lb falls in the tail end or the low probability area of the curve, you know that the probably of getting the results due to chance (means water weight, missing meal, being sick) is low. Hence you are convinced your results are due to the diet and therefore rightfully excited. On the other hand, if the weight loss was 2-3 lbs, it will be in the middle of the graph or in the high probability area. And since it in the high probability area, you know there is a high probability or high likelihood that the 2-3lb weight loss is due to errors like water weight, measurement error, skipping a meal and so forth or chance. In fact, this is exactly how the concept of p-value works. The probability value here is simply the P-value.
What about studies?
Wait… but in studies, the p-value is the probably of the results due to sampling errors, right? How do we get a graph of sampling errors?
Study distribution graph: Yes, in a study, instead of a personal distribution graph, we have a study distribution graph. Unlike the individual weight changes in the personal distribution, each circle represents the average weight of a random sample. And place of errors due to water weight, skipping a meal and so forth, here the errors are due to selecting different samples, namely sampling errors. Remember the section we talked about the study about weight of the people in Mars?
And guess what? Just like your personal graphs, there is a high probability area and low probability area in the study distribution graph. The tail end of the curve or the low probability area represents probability of 5%. So anytime your results are on the tail area, we know the probability is less than 5%.
Now just like the personal distribution graph, if the study results fall on the tail end or the low probability area of the curve, we know that the probability value or p-value is less than 5%. That is, the probability of results being due to chance, in this case sampling error, is very low. Hence, we say that the weight loss is due to the diet or the drug or the intervention. Or we say the results are statistically significant. And that is all there is to know about the P-value.
Now for a few commonly asked questions:
You can skip this section if you desire to:
1. How do we get the study or sample distribution in a study?
Good question. The official name of this graph is the “sampling distribution” since it represents the “sampling errors”. As you know by now, if it weren’t for this graph, there is no way we can find the p-value.
Imagine the weight loss study we talked about where the researcher takes 3 random people out of a population of 10. Theoretically if he takes 100’s of random samples of 3 subjects, we will get a curve which looks exactly like the personal distribution graph with high and low probability area. Now all we need is the distance between the middle region and the tail area, right?
To get the distance, we use the only two information available to us; the average of our sample and the number of subjects or sample size. Plugging these into an equation and using certain statistical assumptions, we get the distance. The catch here is that as the sample size increases, the distance between the middle region and the tail area gets shorter. Hence, it becomes easier for our result to fall on the tail area with larger sample sizes. Sp P-value depends on the magnitude of our result AND our sample size.
2. Ok. Why did you choose 5% as the cut off and not 10%? And how on earth do you know the tail area is 5% probability?
Glad that you asked. The 5% is an arbitrary cut-off. We still use it because of of the force of convention than anything else. In some fields, like particle physics the threshold is .003.
If we graph physical measurements, like height, blood pressure in 1000’s of people, the graph will look like a bell curve (looks like a bell). And some very smart people have calculated that 95% of the values will fall in the middle area and 5% falls on the tail area. That’s how we know the tail area gives us 5% of the probability.
3. The actual definition of the p-value says”, The P value is the probability of getting the results you did (or more extreme results) when the null hypothesis is true. What is the null hypothesis and why do we need it?
A null (means zero) hypothesis means that we are hypothesizing that there is zero or no difference between our two groups (for example weight loss drug and control group). In fact, we do a study because we think there is a difference between the two groups and want to show there is a difference. So stating the null assumption prior the study is a bit weird.
Now why do we need this weird assumption in the definition? Remember, the 1st important point in personal weight loss example: My personal distribution is my typical weight fluctuations when I am NOT trying to lose weight or when I am NOT on a diet. If the graph included the weight lost due to the diet, you have no clue whether the 5 lb is due to the water weight, measurement error or due to the diet, right? Hence the p-value totally depends on this assumption of null hypothesis.
4. So is p-value the probability of getting the results due to ‘chance’?
Strictly speaking, nope. All we did was we just took the 5lb loss and superimposed on our personal distribution graph. The result of 5lb we got could still be 100% due to chance. A great analogy is winning the lottery ticket: Although winning a lottery is extremely unlikely and would fit nicely in the tail area or the low probability area of our distribution, none will dare to to say that he/she won the lottery due to trickery and not due to chance because the p value is less than 5%, right?
5.. So if the p-value is less than 5%, we can say the results are credible?
Always keep in mind that the p-value is a measure of the sampling error or just a measure of statistical uncertainty. Hence the reason when it is low, we call the results ‘statistically’ significant or ‘statistically’ important
The study could have very low p-value, but it could be still biased if the methodology sucks, the instruments used are not valid, there is no randomization, no blinded testers and so forth. Unfortunately, people love to ignore these problems and just blindly focus on the p-value.
Conclusions
I really hope you have a better understanding of the p-value after reading the article. I have omitted the details, like standard error/deviation, alternate hypothesis, normal curve and such and just focused on the big picture. I do think without the personal weight loss example it is quite hard to grasp the concept. And I have read almost every other statistical approach/book to explain p-value.
Next time, when someone talks about a p value, 1) Try to picture the personal or study distribution when the drug or the intervention has NO effect 2) and now superimpose the study results on this graph. 3) If the results fall in the tail area or the low probability area, then p-value is below 5%, and the study is ‘statistically significant’.
Wishing all my Exercise Biology readers a wonderful 2017!
Related Articles
Rahul Gupta | Fri February 28, 2020
suppose i am calculating P value. but i dont have control group so what can be done?? can i compare it with standard group??
Anoop | Tue March 10, 2020
Hi Rahul,
Usually if you don’t have a control group, you compare it with the pre-test/baseline values of the same group.
Hope it helps
Anoop
